Selecting K
General comments
The number of factors, K, determines scHPF’s granularity. An appropriate number of factors depends on both the data being fit and the intended application of the scHPF model. In our experience, subsequent analyses on cell scores (eg. UMAP) are stable across a reasonable range of K, while interpretability (gene scores) can be more K-dependent.
Example workflows
1. Exploratory analysis on a single sample
In some cases, if a user has a single sample, it may be appropriate to increase
or decrease K manually according to the desired resolution. Granularity at
the level of expression programs can be assessed qualitatively using the
per-factor ranked gene lists in ranked_genes.txt (from scHPF score with
the -g option). For example, if genes for two cell types appear in the same
factor, one might increase K. Resolution can also be assessed quantitatively
using
cell type respresentation, or
other quantitative criteria.
When using this approach, we encourage the user to always try at least two values of K in any direction, as scHPF is multimodal and behavior is not always monotonic. K in the neighborhood of the number of clusters is often a good starting point.
2. Consistent choices across multiple models
Applying scHPF separately to multiple partitions (as in [SzaboLevitin2019]) necessitates a uniform procedure for choosing the number of factors. To maximize interpretability while being quantitative and consistent across models, we usually train scHPF across a range of K’s for each partition and select the per-dataset number of factors using a heuristic suitable to our intended application (example criteria). An example workflow might be:
Choose an appropriate selection criteria for the problem at hand (examples).
Guess a minimum number of factors, Kmin. Values slightly less than the number of clusters in the dataset are usually a good starting point (e.g. Kmin = number of clusters - 2). Guess a maximum number of factors, Kmax, not worrying too much if we are low since we’ll refine later (e.g. Kmax = Kmin + 8).
Train scHPF models for K in range(Kmin, Kmax +1). Advanced note: I sometimes use a step size of 2 or 3 on the first pass to check that the range is reasonable, but recommend a final step of 1 (scHPF is multimodal, so results may not be monotonic).
Evaluate the models using the selection criteria from 1. Expand/refine the range accordingly. For example, if Kmax passes our criteria, we should increase Kmax.
Repeat 3-5 as needed.
Example selection criteria
1. Cell type representation
In [Levitin2019], we chose K based on scHPF’s representation of cell types in the data. Specifically, we selected the smallest K such that every well-defined cluster was most strongly associated with at least one unique factor [Levitin2019, Appendix Figure S8]. This method is intuitive, and can work well when many cell types are present, but depends on the quality and granularity of clustering. It is also difficult to standardize across multiple models trained on different data.
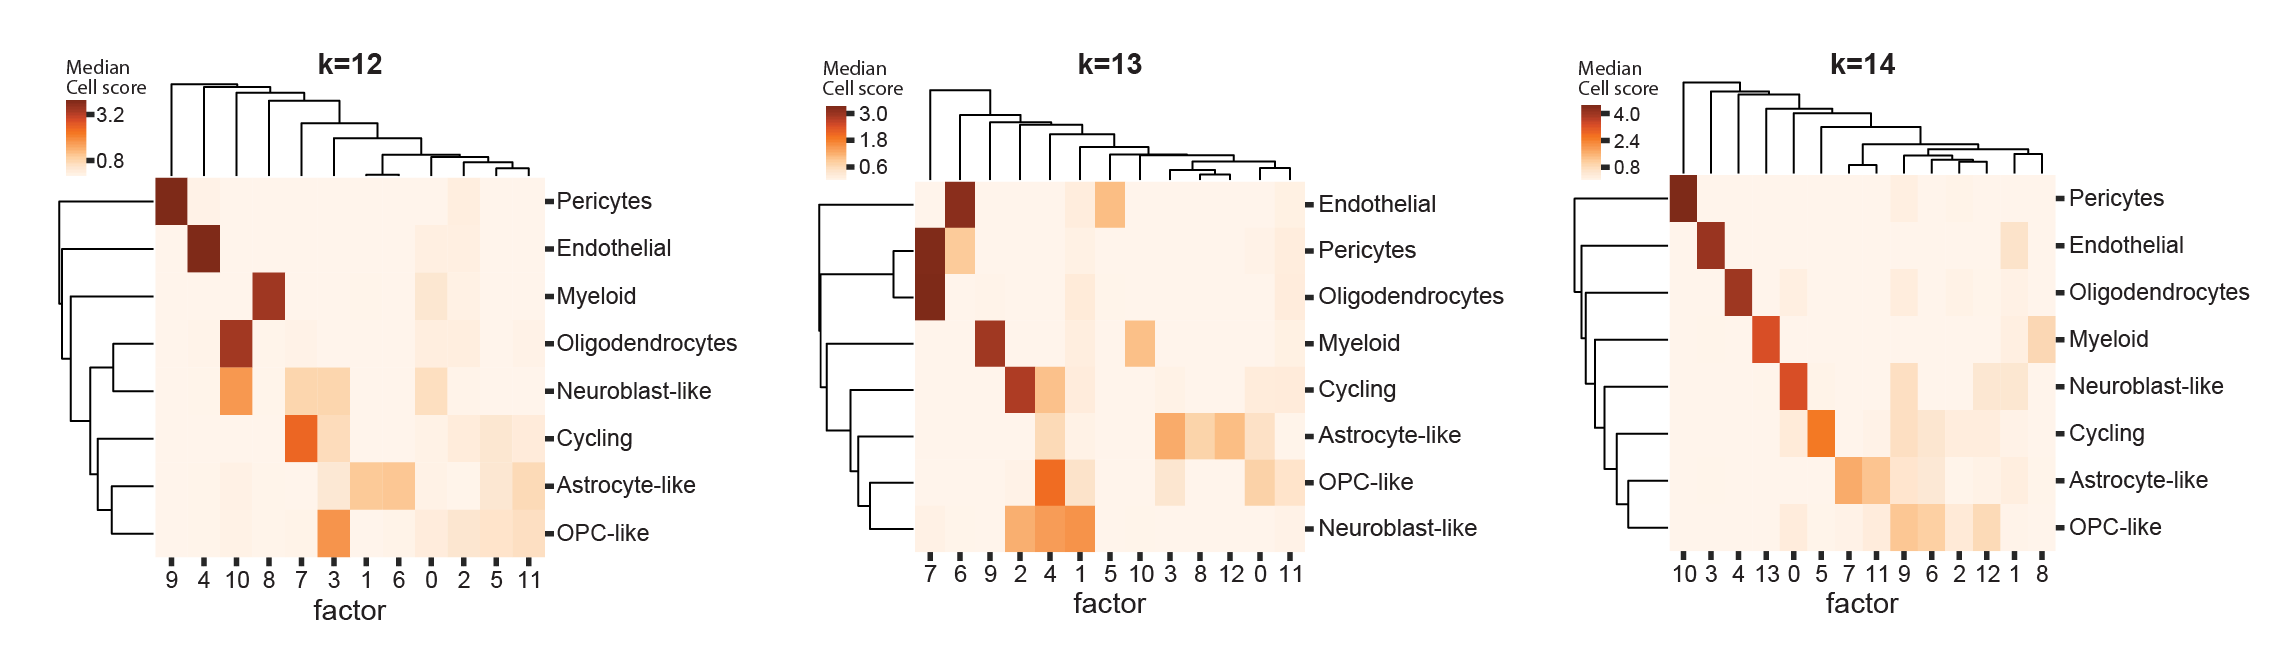
Median cell score per factor and cluster in a high-grade glioma for 12, 13, and 14 factors in [Levitin2019]. At 14 factors, all clusters are most closely associated with at least one unique factor.
2. Gene signature overlap
To find common patterns of gene expression across multiple models in [SzaboLevitin2019], we selected K such that factors in the same model did not have significant overlap in their top genes (where top genes are defined as the n highest scoring genes per factor). This reflected our prior that programs should be distinctive with respect to gene scores, and the further requirement that models should have similar granularity across datasets with different levels of complexity.
The scHPF score command automatically produces the file
maximum_overlaps.txt, which contains factors’ maximum pairwise overlap and
corresponding hypergeometric p values at different cutoffs.
For standard significance thresholds and reasonable n, this method can be quite strict, resulting in lower granularity factorizations for some datasets. Using cellular resolution or cell type respresentation may find higher resolution factorizations in these cases.
3. Cellular resolution
Cellular resolution directly evaluates a model’s granularity by specifying how many factors, on average, should explain a given portion of a cell’s total cell scores. We have found it especially useful for datasets where gene signature overlap is too strict.
We define cellular resolution as the maximum K such that, on average, cells’ n highest scoring factors contain at least r*100 percent of their total score across all factors. So if we want to find a model where the 3 factors with the highest score in a cell contain at least 70% of its total score (on average), n would be 3 and r would be 0.7.
We can evaluate cellular resolution using one of scHPF score’s outputs, a
file called mean_cellscore_fraction.txt (potentially with a prefix). The
file’s two columns, nfactors and mean_cellscore_fraction, represent the
mean fraction of each cell’s total cell score allocated to its top nfactors
factors. If we want to find a model at n =3 and r =0.7 resolution, we
might follow the example workflow above, and select the
largest K such that mean_cellscore_fraction >= 0.7 when nfactors = 3.